Table of Contents
Website performance in search is one of the most important aspects of digital marketing. Google Search Console (GSC) is a tool that provides website owners and SEO enthusiasts with critical data, helping them track performance, fix issues, and ultimately improve their site’s visibility in search engine results. Among the many features GSC offers, Performance Reports in GSC are an invaluable resource for assessing your search performance through critical metrics like click-through rate (CTR), impressions, queries, and average position.
What Are Performance Reports in GSC?
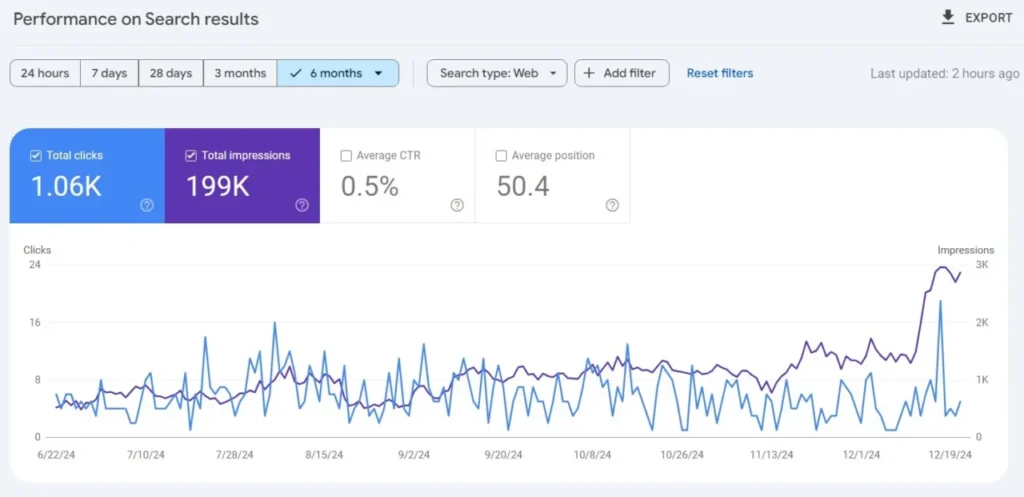
Performance Reports in Google Search Console give you an overview of how your website is performing in Google Search. These reports track your site’s presence on Google and offer detailed data on search queries, clicks, impressions, CTR, and average position.
Think of Performance Reports as your SEO compass. They show you which pages and keywords are getting visibility, what users are clicking on, and which areas need improvement. This data is gold for marketers and SEO experts trying to refine their strategy.
To access Performance Reports, log into your Google Search Console account, click on the “Performance” tab, and voilà—you’ll get a treasure trove of data to work with.
Search Performance Metrics That Matter

When you open a Performance Report in GSC, the displayed metrics can seem overwhelming. But each piece of data plays an important role in your SEO analysis. Let’s break them down.
1. Search Performance
The search performance metrics in GSC show the total clicks, impressions, CTR, and average position for a specific timeframe. This gives you a top-level snapshot of how your website is performing.
For instance, if your website had 10,000 impressions but only 500 clicks, it means your CTR is low, and you might need to work on your meta titles and descriptions to improve engagement.
Example:
Say you run a fitness blog, and one of your pages, “10-Minute Home Workouts,” appears 1,000 times in search results but only gets 20 clicks. With a 2% CTR, it’s clear you might need to optimize the title to attract more clicks.
Google Search Console displays this search performance data for all your URLs, which allows you to identify consistently underperforming pages or top-performing ones you can further optimize.
2. Click-through Rate (CTR)
Your click-through rate (CTR) is one of the most actionable metrics in SEO. The calculation is given below:
CTR = (Clicks ÷ Impressions) x 100
A higher CTR indicates that users click on it. Conversely, a low CTR might be a sign that your titles, descriptions, or even search result rankings are falling short of capturing user interest.
How to Improve CTR:
- Write compelling meta titles and descriptions. Use action-oriented and specific language, like “Learn the Top 5 Marketing Tools Today.”
- Add structured data. Enable rich snippets like star ratings or FAQ sections to make your listing stand out in search results.
Real-Life Example:
HubSpot increased its blog traffic by tweaking title tags and meta descriptions to make them more clickable. Look for underperforming keywords in your GSC reports and test similar optimizations.
3. Impressions
Impressions show how many times your web pages appeared in Google search results. This metric indicates visibility but doesn’t necessarily translate into clicks.
A page with high impressions but low clicks might indicate an issue with search intent alignment or lack of compelling headlines and descriptions.
Example:
If your webpage appears 5,000 times for the keyword “best laptops under $1,000” but only receives 50 clicks, you need to analyze whether your page truly answers the searcher’s question or if the meta description can be improved.
Pro Tip:
Impressions can also reveal trending keywords. If a previously unnoticed query is now bringing impressions, that may be a golden opportunity to create new, relevant content.
4. Queries
Queries data in GSC shows the exact search terms users type into Google to find your site. Reviewing these queries is crucial because it gives you insight into two things:
- The keywords that are working well for your website.
- Gaps in your content strategy where new opportunities exist.
How to Leverage Queries:
- Create new content targeting high-impression, low-ranking keywords.
- Identify long-tail keywords bringing traffic and build specialized pages around them.
Example:
Suppose a search query like “how to fix a leaky faucet yourself” is driving traffic to your DIY plumbing website. If you don’t already have a detailed guide for this exact topic, you have an immediate content opportunity.
5. Average Position
Average position reflects where your page ranks in search results for a particular keyword. Google calculates the average of all rankings for a page across the queries that triggered it.
What to Do with This Metric:
- If in Position 1-10: Work on click-through optimizations to increase site visits.
- If in Position 11-20: Focus efforts on improving content and backlinks to push into Page One ranking.
Real-Life Example:
If GSC shows that your article on “Best Travel Backpacks” has an average position of 11, updating your content with more recent backpack reviews or additional comparison details could boost your ranking into the coveted top 10.
Actionable Insights from GSC Performance Reports
Now that you understand the core metrics, here’s how to use them to improve your digital marketing efforts.
- Identify Opportunities: Focus on high-impression queries with low CTR or rankings. These are low-hanging fruits for optimization.
- Monitor Content Performance: Use Performance Reports to measure how new content ranks over time.
- Keyword Refinement: Evaluate queries to uncover new keyword trends or long-tail opportunities.
- Spot Tech Issues: Sometimes, pages with low CTR can indicate deeper issues, like slow site speed or poor mobile responsiveness.
Elevate Your SEO Strategy

Performance Reports in GSC are essential for understanding your website’s visibility and potential. By consistently analyzing metrics like click-through rate, impressions, queries, and average position, you can discover meaningful insights and fine-tune an SEO strategy that delivers results.
Conclusion
Google Search Console’s Performance Reports are a powerful tool for understanding and enhancing your website’s search visibility. By analyzing key metrics such as CTR, impressions, queries, and average position, you can uncover opportunities to optimize content, improve rankings, and refine your digital marketing strategy. Regularly leveraging these insights will not only help you identify areas of improvement but also ensure your SEO efforts are aligned with your business goals. Mastering GSC is essential for staying competitive in the dynamic world of digital marketing.
FAQs on Google Search Console Performance Reports
1. What is Google Search Console (GSC)?
Google Search Console is a free tool provided by Google that helps website owners monitor, maintain, and troubleshoot their website’s presence in Google Search results.
2. What are Performance Reports in GSC?
Performance Reports in GSC provide detailed data on your website’s search performance, including metrics like clicks, impressions, click-through rate (CTR), and average position.
3. Why are Performance Reports important?
These reports act as an SEO compass, helping you identify which pages and keywords are performing well, and which areas require improvement. They provide actionable insights to refine your SEO strategy and boost search engine visibility.
4. How can I access Performance Reports in GSC?
Log into your GSC account, navigate to the “Performance” tab, and explore the detailed metrics related to your website’s search performance.
5. What metrics do Performance Reports include?
The main metrics are:
- Clicks: Number of times users clicked on your website in search results.
- Impressions: Number of times your website appeared in search results.
- CTR (Click-through Rate): The percentage of impressions that resulted in clicks.
- Average Position: The average ranking of your site across queries.

